Guides
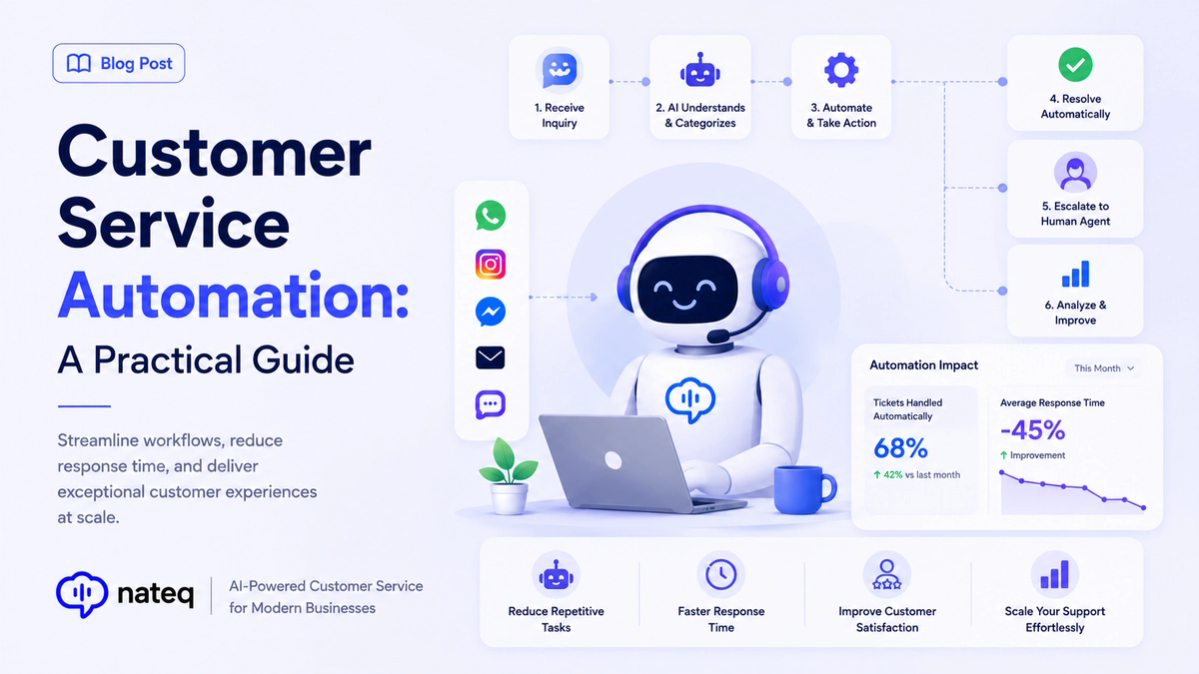
Customer Service Automation: A Practical Guide
Customer service automation handles repetitive work so agents focus on people. Learn what to automate, what to keep human, and how to start.
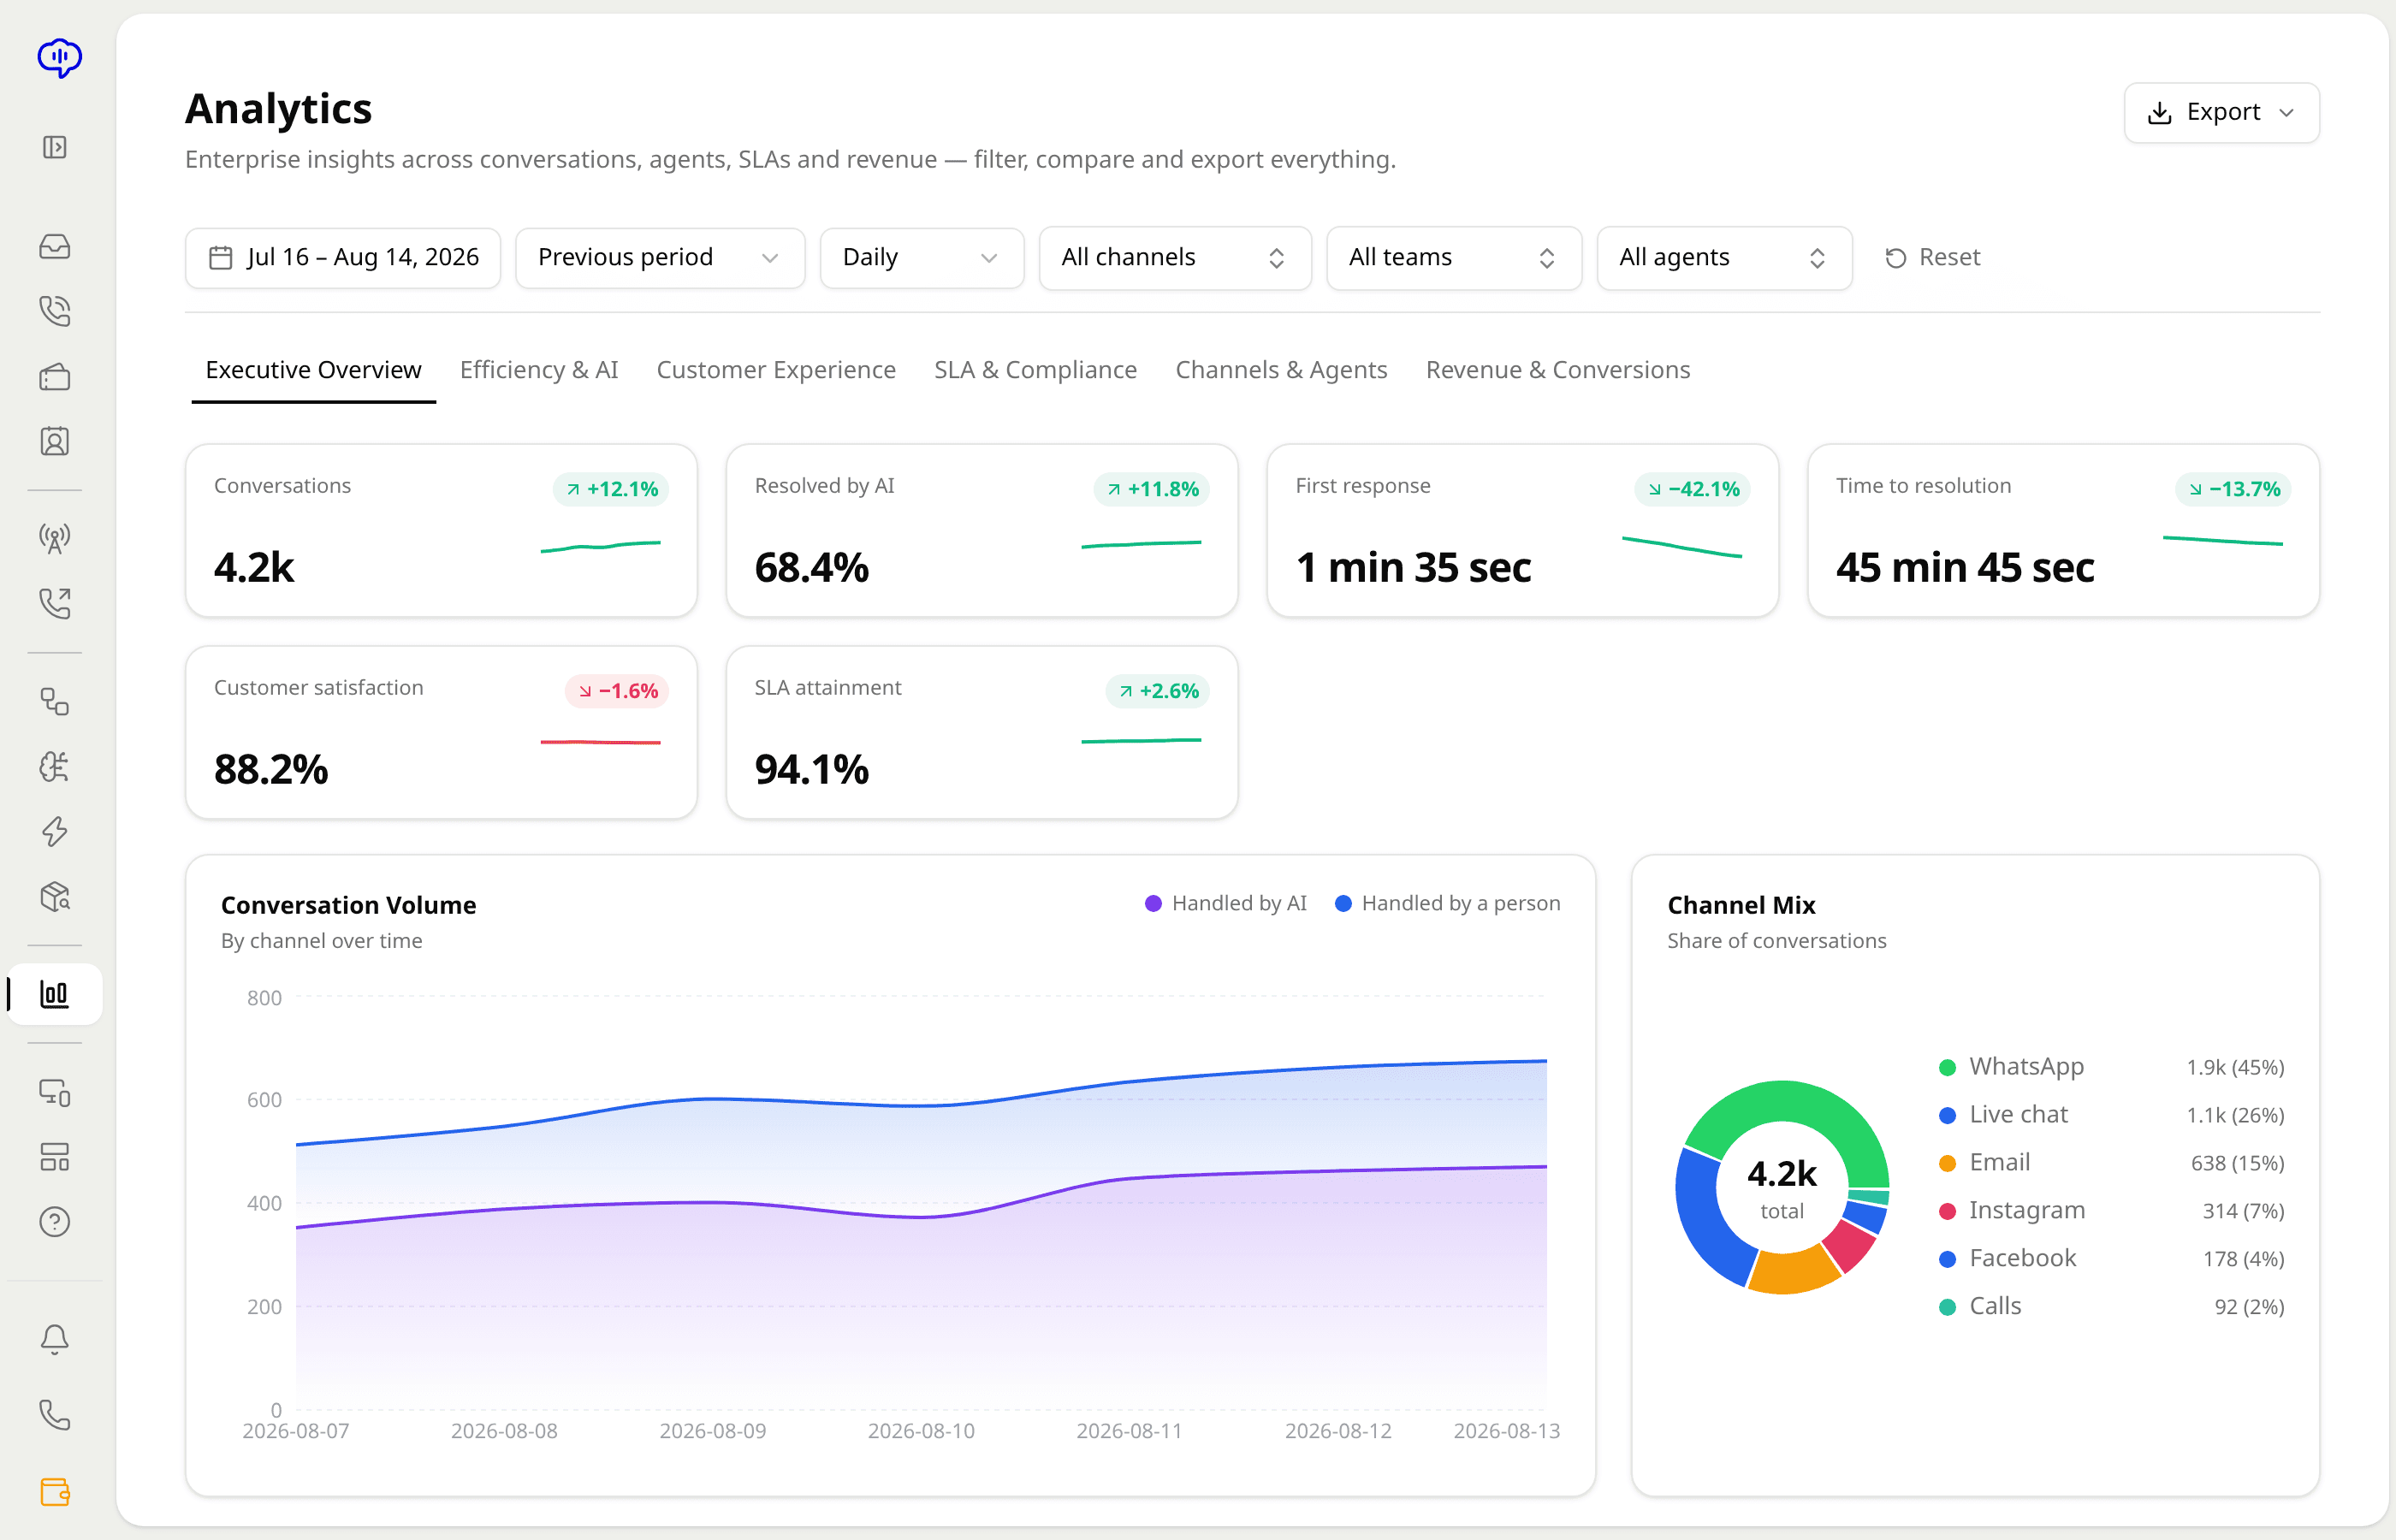
2 min readReal-time dashboards and detailed reports give you full visibility into team performance, customer satisfaction, and trends, so you can act on data instead of guesswork.
Last updated:
See key metrics at a glance in real time, from open volume to response times across channels.
Track customer satisfaction and loyalty over time to see where support is delighting or falling short.
Measure first response and resolution times so you can set realistic SLAs and spot bottlenecks.
Compare workload and outcomes across agents with leaderboards that recognize your top performers.
Build the exact report you need by choosing the metrics, filters, and timeframes that matter to you.
Export reports to CSV to share with stakeholders or plug into your own analytics stack.
Open a real-time dashboard to see support health the moment it changes.
Build custom reports on CSAT, response times, and agent performance.
Export to CSV and bring the numbers to your team and stakeholders.
Yes. Live dashboards show key support metrics as they change, across every channel in one view.
Yes. Nateq tracks CSAT and NPS over time so you can see how satisfaction trends across your team.
Yes. A custom report builder lets you choose the metrics, filters, and timeframes you care about.
Yes. Reports can be exported to CSV to share with stakeholders or feed into your own analytics tools.
Customer service automation handles repetitive work so agents focus on people. Learn what to automate, what to keep human, and how to start.
2 min read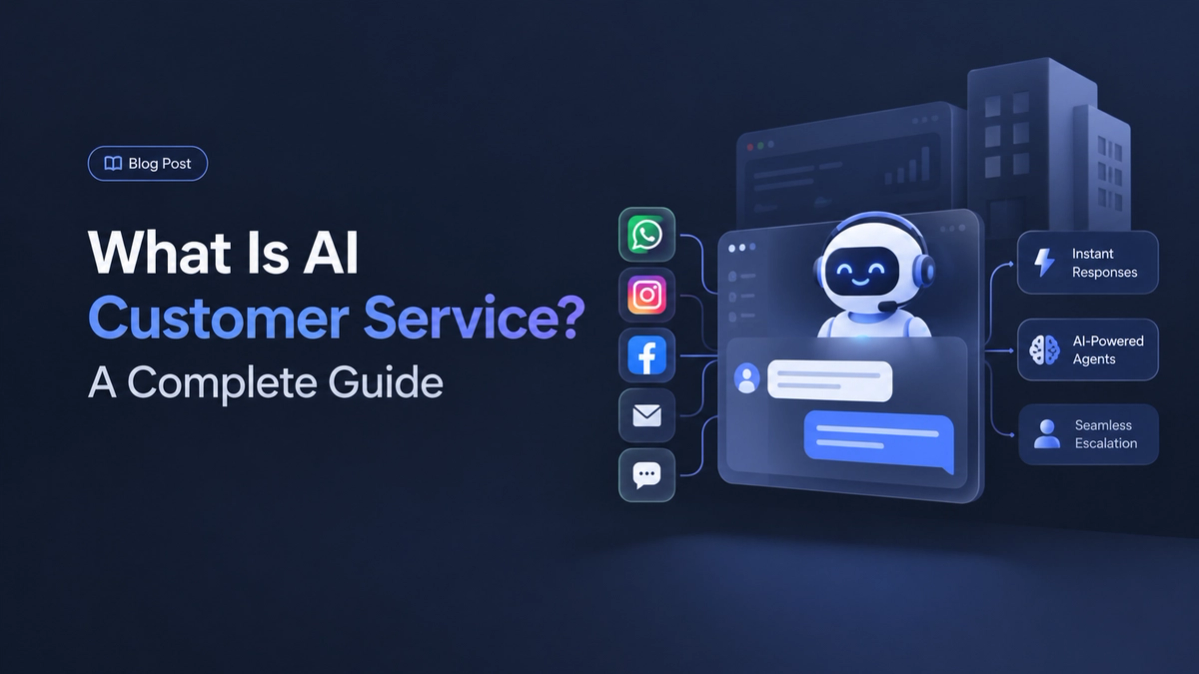
AI customer service uses artificial intelligence to answer questions, route tickets, and support agents. Here is how it works and why it matters.
2 min readBring every conversation into one intelligent platform. Try it free for 14 days, no card required.